|
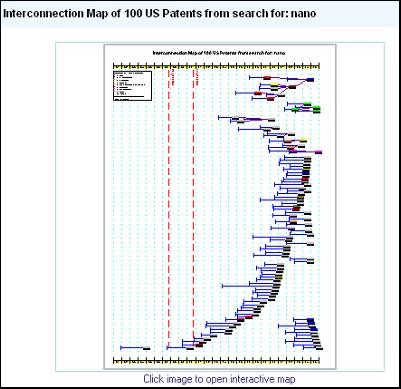
The horizontal (x-axis) is time. Each box on this map is a U.S. patent. The boxes are oriented in time with the left edge of each patent box aligned with the patent's issue date. The tail to the left of the box shows when the patent was filed in the United States.
The lines connecting the patent boxes are the prior art citation references.
At the top of the map shown in this example there is a small cluster of patents that cite each other. Note: IPVision map layout algorithms minimze the number of crossed lines to maximize visibility - the more clustered patents appear towards the top of an IPVision map.
The patents toward the bottom of the map do not cite any other of the patents that were found in the search. Note: if the patents being mapped were the patent portfolio of a company then the "unclustered" new patents at the bottom of an Interconnection Map might represent new technology investments - i.e., they are newly issued patents and they don't cite any other patents in the company's patent portfolio.
Click on the map to launch a "live Interactive Map" in a new window. On the Interactive Map you can access the Patent Detail Menu by right clicking on a patent box.
|
 Advantage
™
Patent Analytics
Advantage
™
Patent Analytics