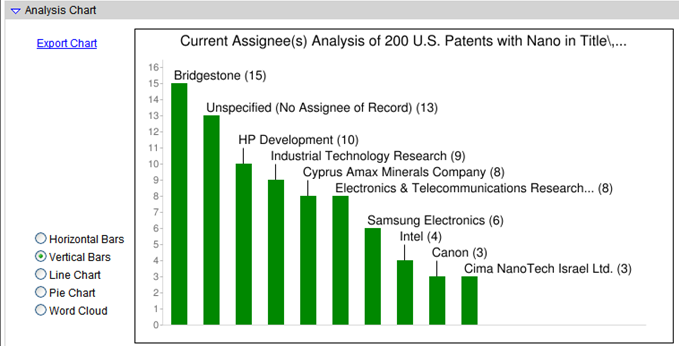
The Analysis Chart Area appears toward the top of the Analysis Results Page. This presents a visual chart display of the Analytic you have chosen. You can hide the chart area by clicking on the "triangle" in front of the words "Analysis Chart". The following shows a Current Assignee Analysis Chart:
The default chart view is a bar chart for Analytics other than "dates", which use a line chart. Other chart options are presented to the left of the chart display area.
 Advantage
™
Patent Analytics
Advantage
™
Patent Analytics