Analysis Results Page

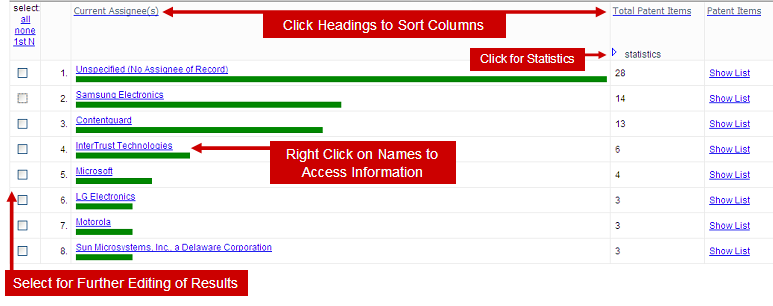
When you run Analytics on a list the results are displayed in an Analysis Results Page. There are 4 main areas on this page:
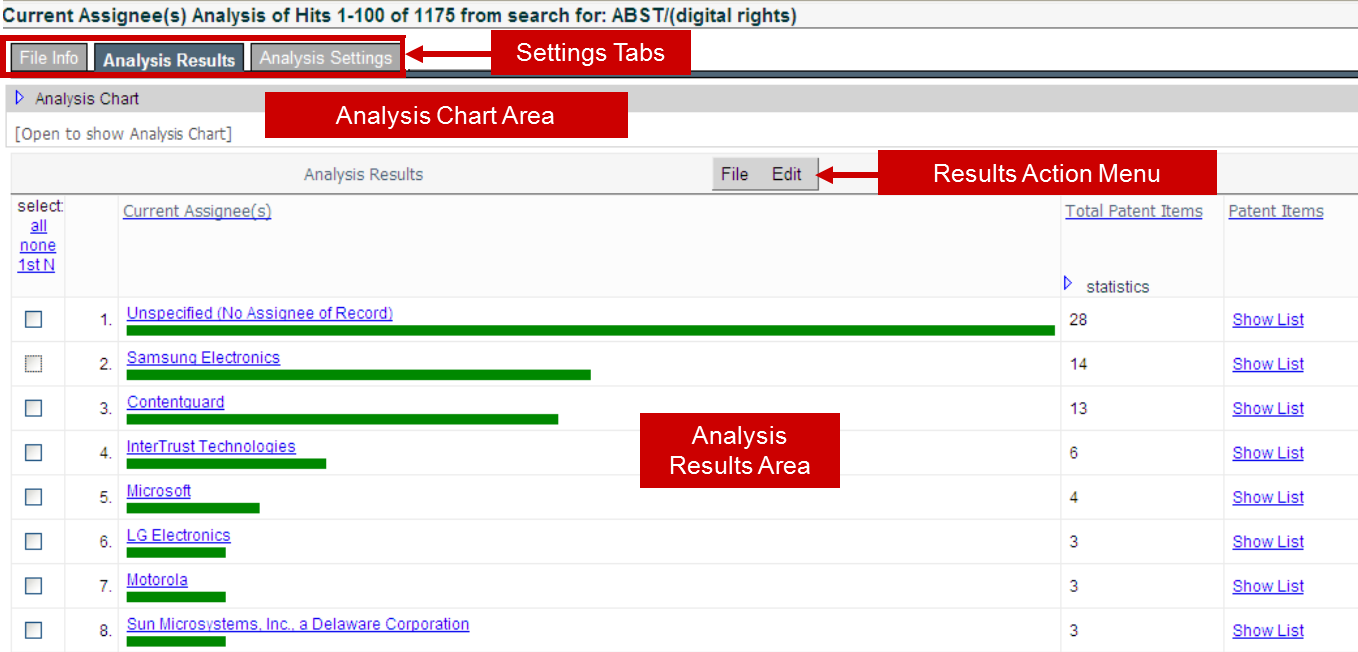
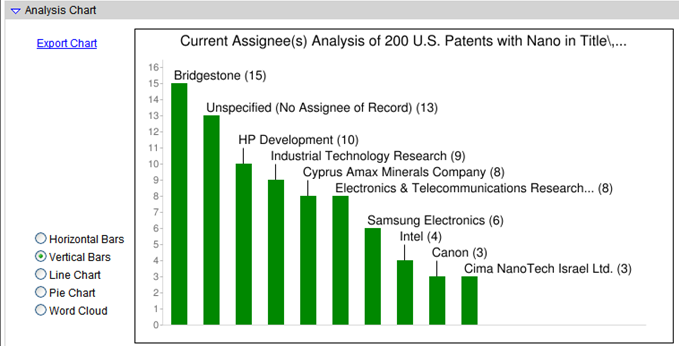
Analysis Chart Area

The Analysis Chart Area appears toward the top of the Analysis Results Page. This presents a visual chart display of the Analytic you have chosen.  You can hide the chart area by clicking on the "triangle" in front of the words "Analysis Chart".   The following shows a Current Assignee Analysis Chart:


Analysis Chart Settings

The default chart view is a bar chart for Analytics other than "dates", which use a line chart. Other chart options are presented to the left of the chart display area.

Settings Tabs

At the top of the Analysis Results Page there is a series of tabs:
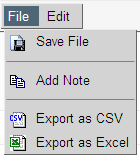
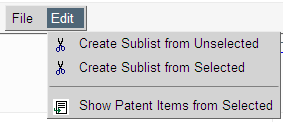
File Info: This tab provides information about how the search or list was assembled.  It provides a "bread crumb" trail to retrace the search or list history.

Analysis Results: This tab displays the results of the Analytics performed.

Analysis Settings: This tab provides certain tools to adjust the Analysis Results page


Results Action Menu
The "pull-down" Results Action Menu contains "File" and "Edit" options:
These pull-down menu options are described below:
File Menu
  • Save File: Use this to save your analysis to an existing or new folder.


  • Add Note: You can add a note to the file. This will appear in the File Info tab.


  • Export as CSV: This menu item allows you to export the analysis into a CSV (Comma-Separated Value) formatted file.
  • Export as Excel: You can export the analysis into a Microsoft Excel file with live links to the patent documents at the U.S. Patent and Trademark Office.
Edit Menu

After you have selected items in your analysis use the Edit Menu to create a new analysis:

  • Create Sublist from Unselected: Use this option when you are selecting items that you do NOT want to keep in the analysis.
  • Create Sublist from Selected: Use this option when you are selecting items that you want to keep.
  • Show Patent Items from Selected: This option will convert the selected analysis subcategories into a list of patents and/or applications.


Analysis Results Area

The Analysis Results Area displays the results in a histogram format.   In this "Current Assignee Analysis" the names of the Current Assignees/Owners are shown in the second column and the number of patents owned by them are shown in column 3.   The Current Assignee names column can be sorted alphabetically by clicking on the column heading.   The Total Patent Items column can be sorted high-to-low or low-to-high by clicking on the column heading.   Statistics about the patent count can be accessed by clicking on the Statistics button.   To access the list of patents for a particular Current Assignee click on the Show List link in column 4.   You can access additional information about the particular Current Assignee by right clicking on that assignee's name.   In column 1 you can select one or more of the entries for further analysis using the Analysis Results Action Menu.

Business User Subscription Level

©2004 - , IPVision, Inc. All Rights Reserved